No. 06 · · 3 min read
Old New York Needs Elephants
New York’s transit came back from the pandemic, but not evenly. Which services rebounded, which filled up, and what do elephants have to do with it?
The idea
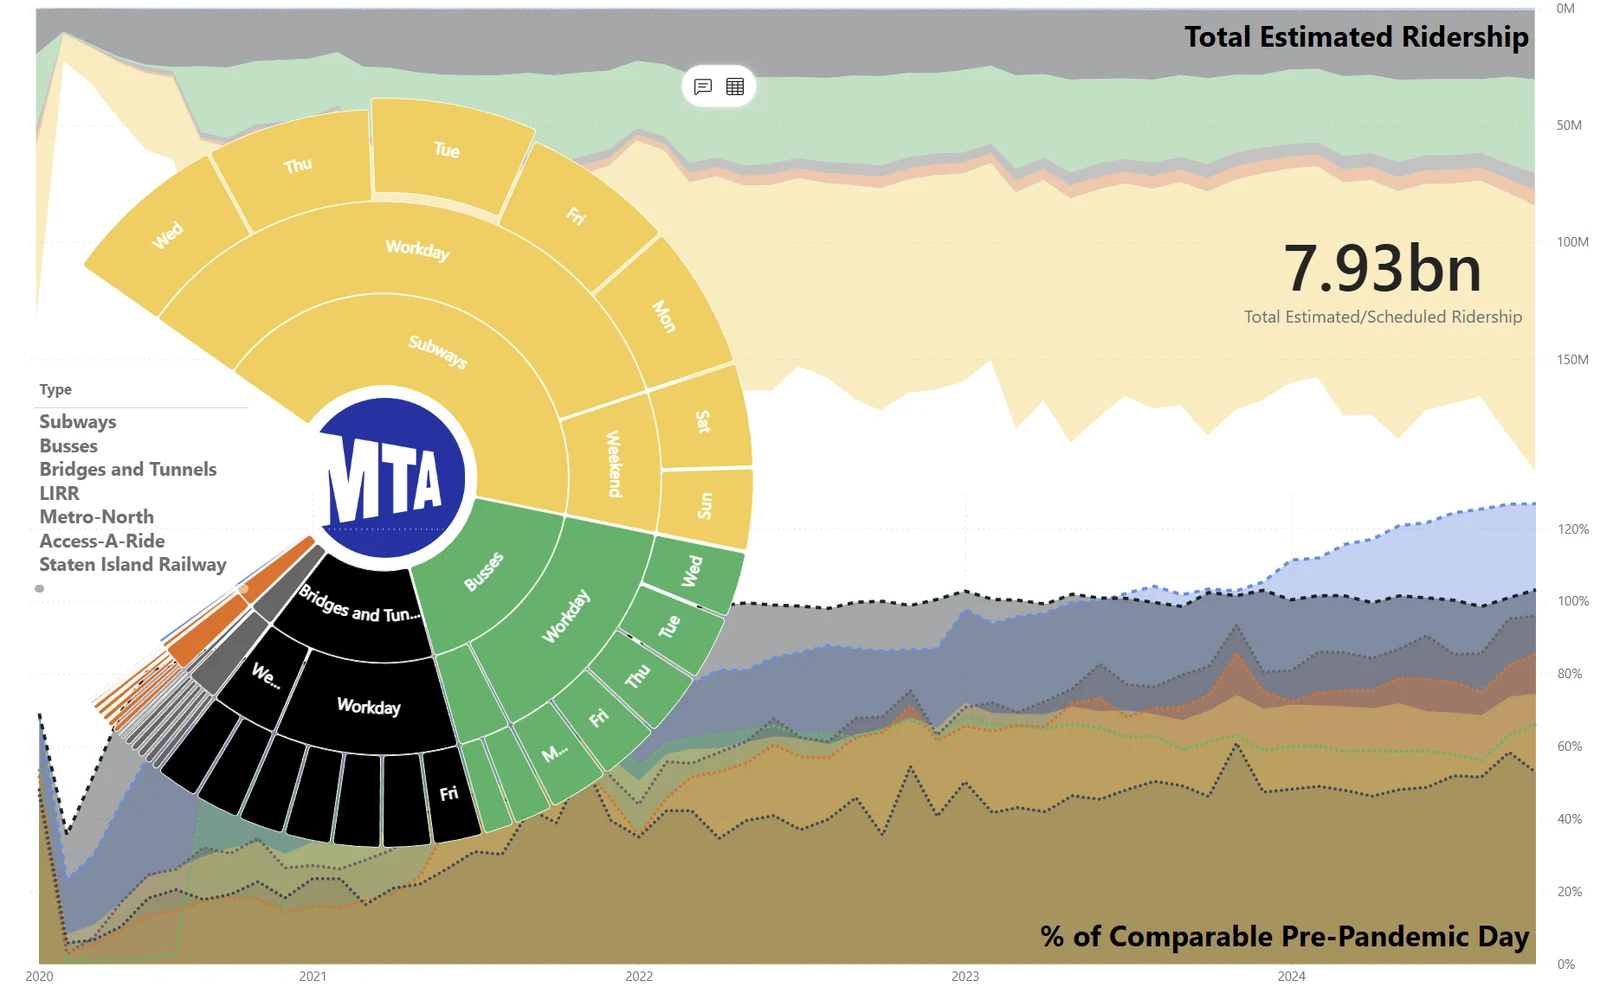
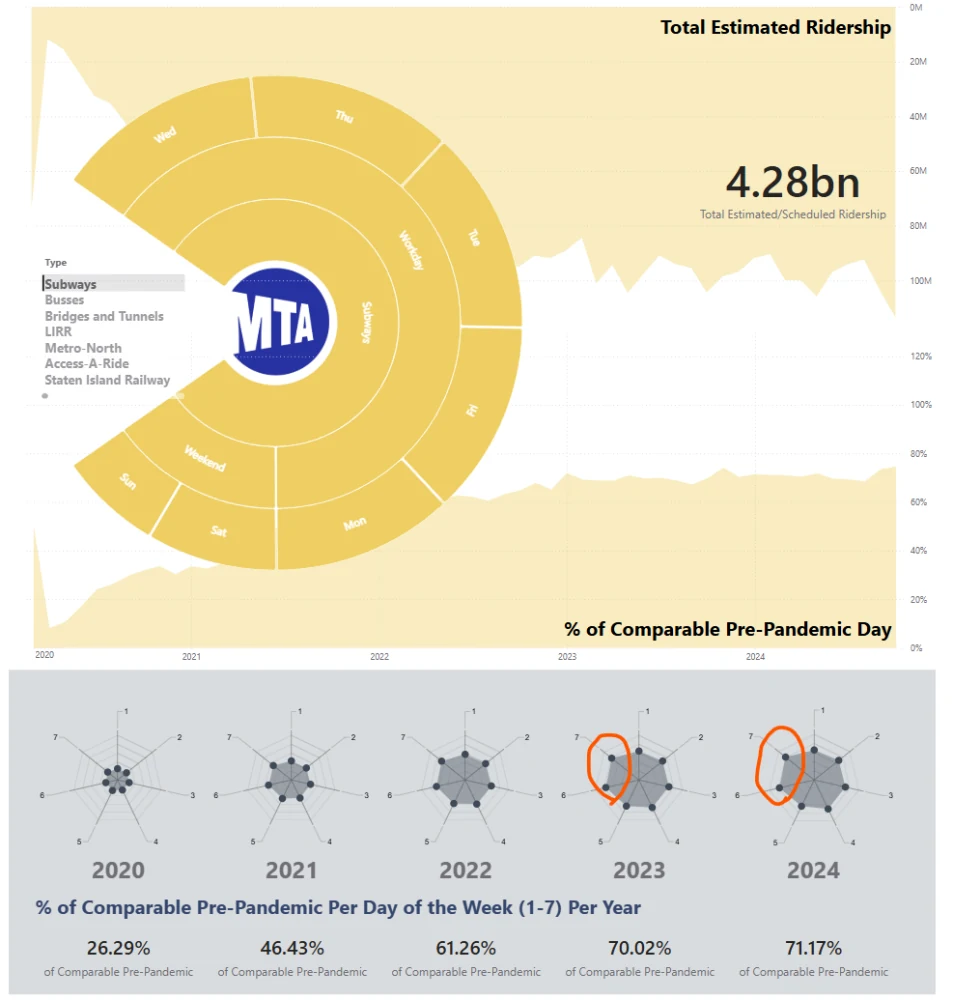
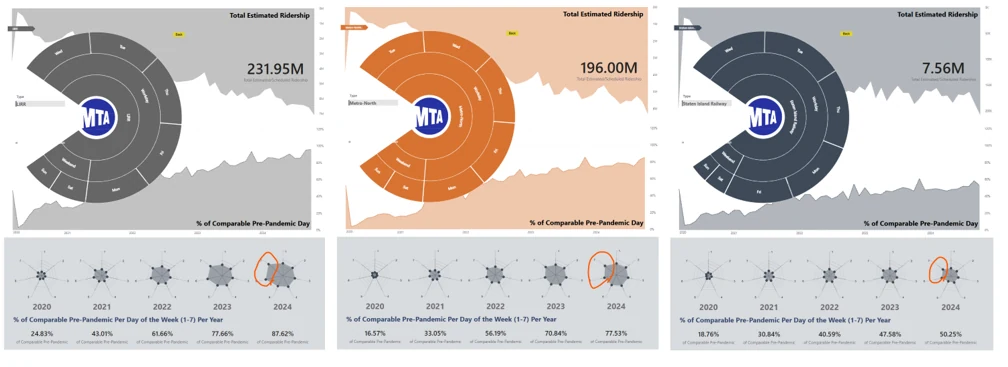
Recovery is not one number. Read service by service, open MTA data tells three stories: weekend riders leading the subway rebound, bridges and tunnels maxed out, and Access-A-Ride surging.
01
Weekends lead the subway rebound
Weekend ridership is recovering faster than weekday commuting, possibly because of remote work.
02
Bridges and tunnels, maxed out
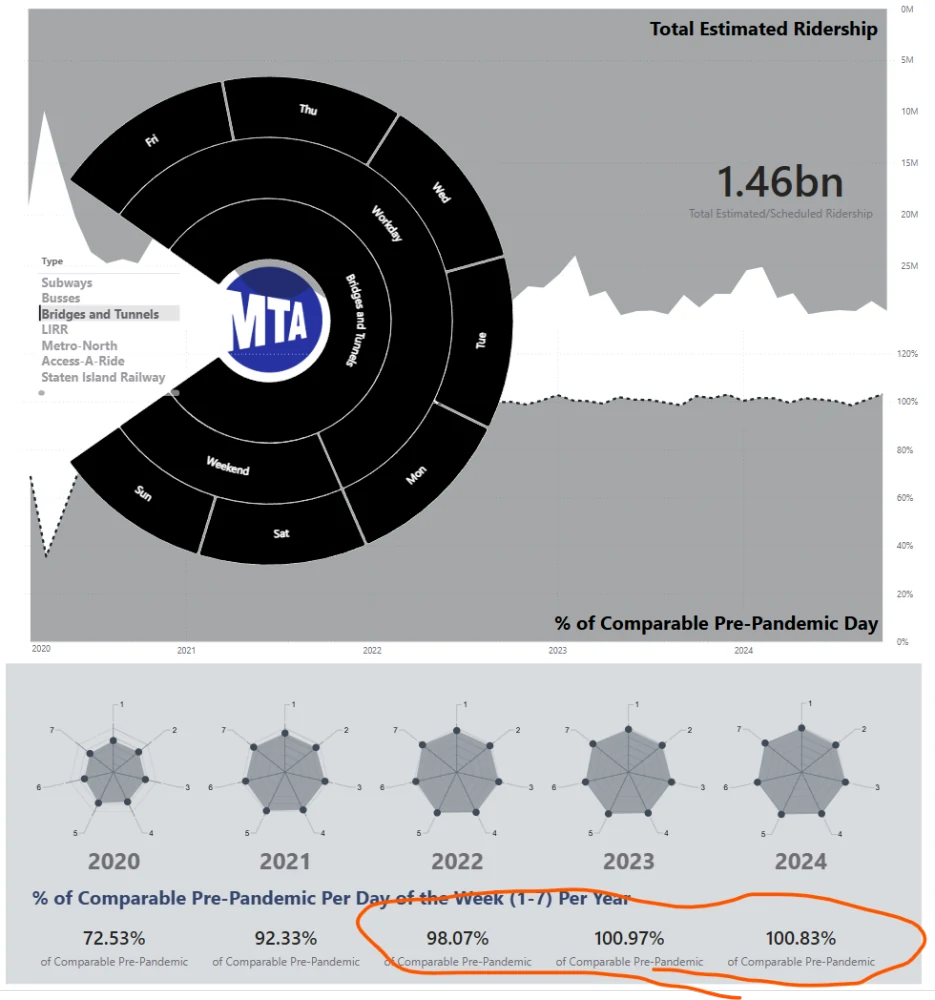
With a fixed capacity, they are running at 103%, and the post floats the idea of new crossings.
03
A 60-year surge
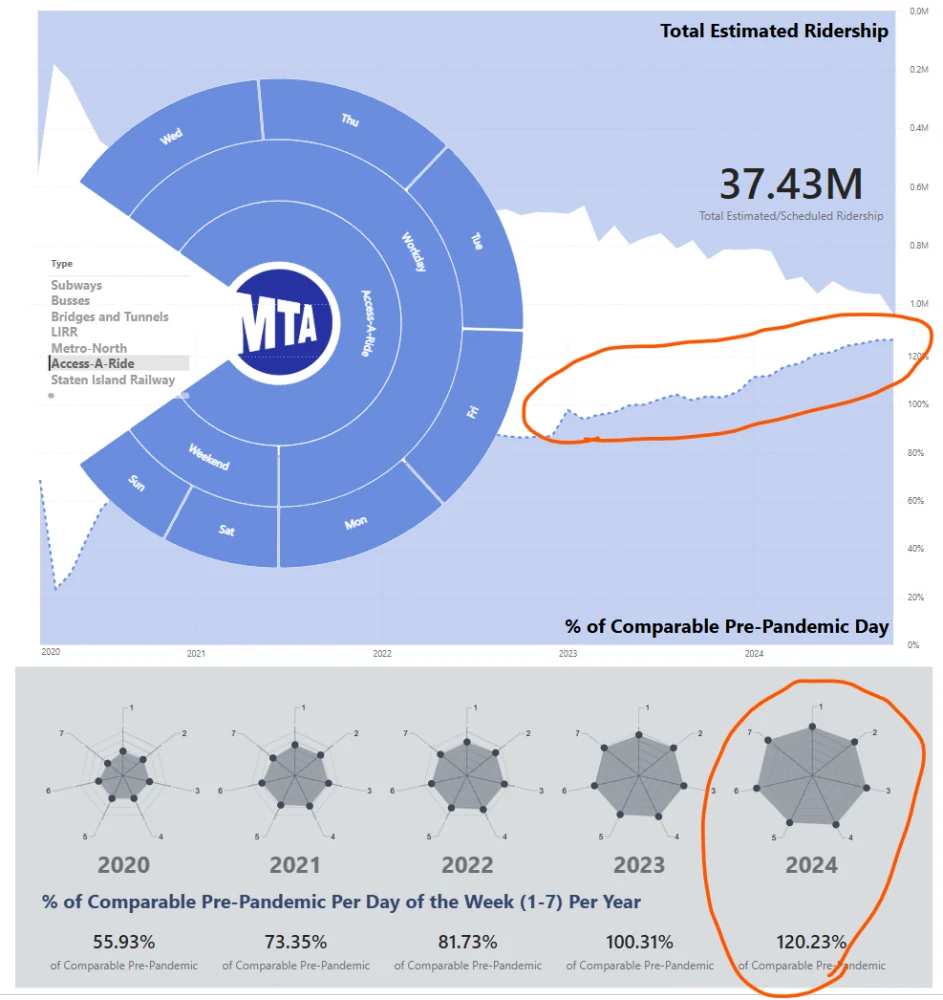
Access-A-Ride has grown steadily by 20% a year since 2022, which the author links to an aging population.
These stories highlight how dynamic and resilient NYC’s transit systems are.
About this project
This project is part of the Maven Commuter Challenge, where data enthusiasts tackle real-world transportation data to uncover insights. Using open data from the MTA, I explored how NYC’s transit systems have been recovering - or thriving - since the pandemic. You can check out the challenge here: Maven Commuter Challenge.
The project itself: https://mavenanalytics.io/project/22767
1. Subways: The Weekend Warriors
While the subways haven’t quite returned to their pre-pandemic glory, there’s an interesting twist: weekend ridership is recovering faster than weekday commutes. Could this be the lingering effects of remote work? The trend isn’t limited to subways; LIRR, Metro-North, and Staten Island Railways tell a similar story. New Yorkers seem to be swapping their rush-hour sprints for leisurely weekend adventures. Is the "work from home, play on weekends" culture here to stay?
2. Bridges and Tunnels: Maxed Out, but Are Elephants the Answer?
The pandemic barely left a scratch on bridges and tunnels - after the first year, traffic levels roared back to nearly pre-pandemic capacity. But here’s the catch: bridges and tunnels have a fixed capacity, and they’re running at 103%. Could New York’s growing demands call for something as grand as the original bridge-opening ceremonies, where elephants marched across to prove their strength? Maybe it’s time to start planning for the next iconic crossings!
3. Access-A-Ride: The 60-Year Surge
Access-A-Ride is the star of the recovery show, growing steadily by 20% year over year since 2022. But why the surge? Flashback to the infamous New York blackout 59 years ago. Nine months later, there was a baby boom - and guess what? That generation is now hitting 60. It’s not just age, though; could New York’s fast-paced lifestyle also be taking a toll on its residents’ health? The city’s population pyramid is shifting, and Access-A-Ride is riding the wave.
4. Bonus: The Geography of Transit
Maps are critical for understanding the big picture, especially for something as vast as the MTA network. I’ve included some visual gems that showcase the geographic spread of services. But here’s the fun part: do you like the color coding? Feedback welcome - don’t hold back on your inner cartographer critiques!
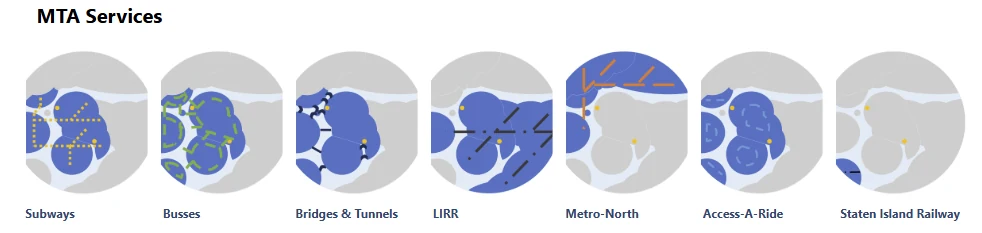
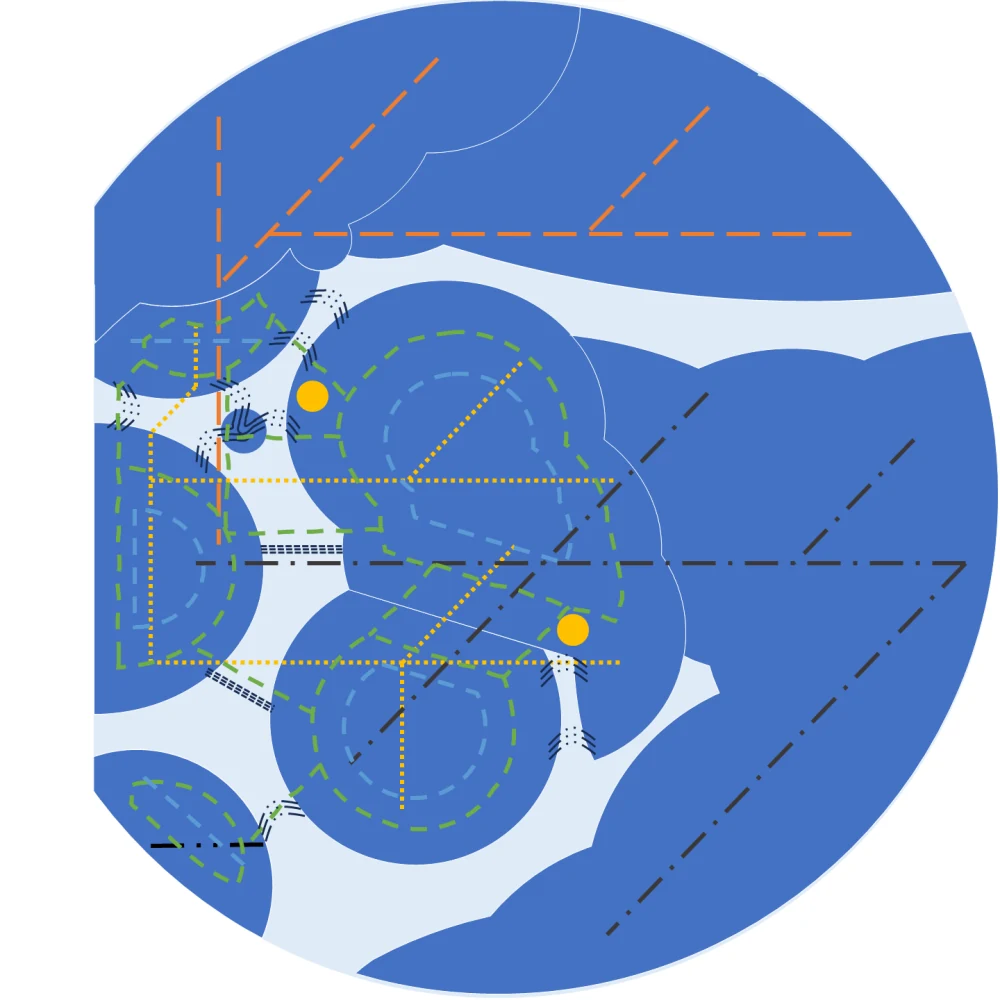
MTA Services
Final Thought
These stories highlight how dynamic and resilient NYC’s transit systems are. From elephants to population pyramids, the trends reveal both challenges and opportunities. So, what do you see when you look at the data? Let’s spark a conversation about the future of New York’s transportation landscape!
PS:
The visualization is designed in Power BI, combining data-driven storytelling with interactive elements to make the insights accessible and engaging. The title, "Old New York Needs Elephants," reflects both the historical nod to elephants symbolizing strength and reliability during NYC's bridge openings and the city's enduring resilience in overcoming modern challenges.
This project not only highlights the city's recovery but also raises thought-provoking questions about the changing dynamics of transportation, commuter behavior, and urban mobility in a post-pandemic world. It aims to inspire discussions on infrastructure resilience, equitable access, and the future of public transit in one of the world’s most iconic cities.