No. 12 · · 2 min read
Creativity Meets Impact: Data Visualization in Humanitarian Response
Power BI usually means financial dashboards and corporate KPIs. What happens when the same tool is used to save lives and rebuild communities?
The idea
The same tools linked with corporate KPIs also help save lives and rebuild communities. A clear dashboard makes humanitarian data accessible and actionable for donors, governments and field staff.
01
Not just for corporate KPIs
Power BI is usually linked with financial dashboards, but the same tools help save lives and rebuild communities.
02
Show what has been achieved
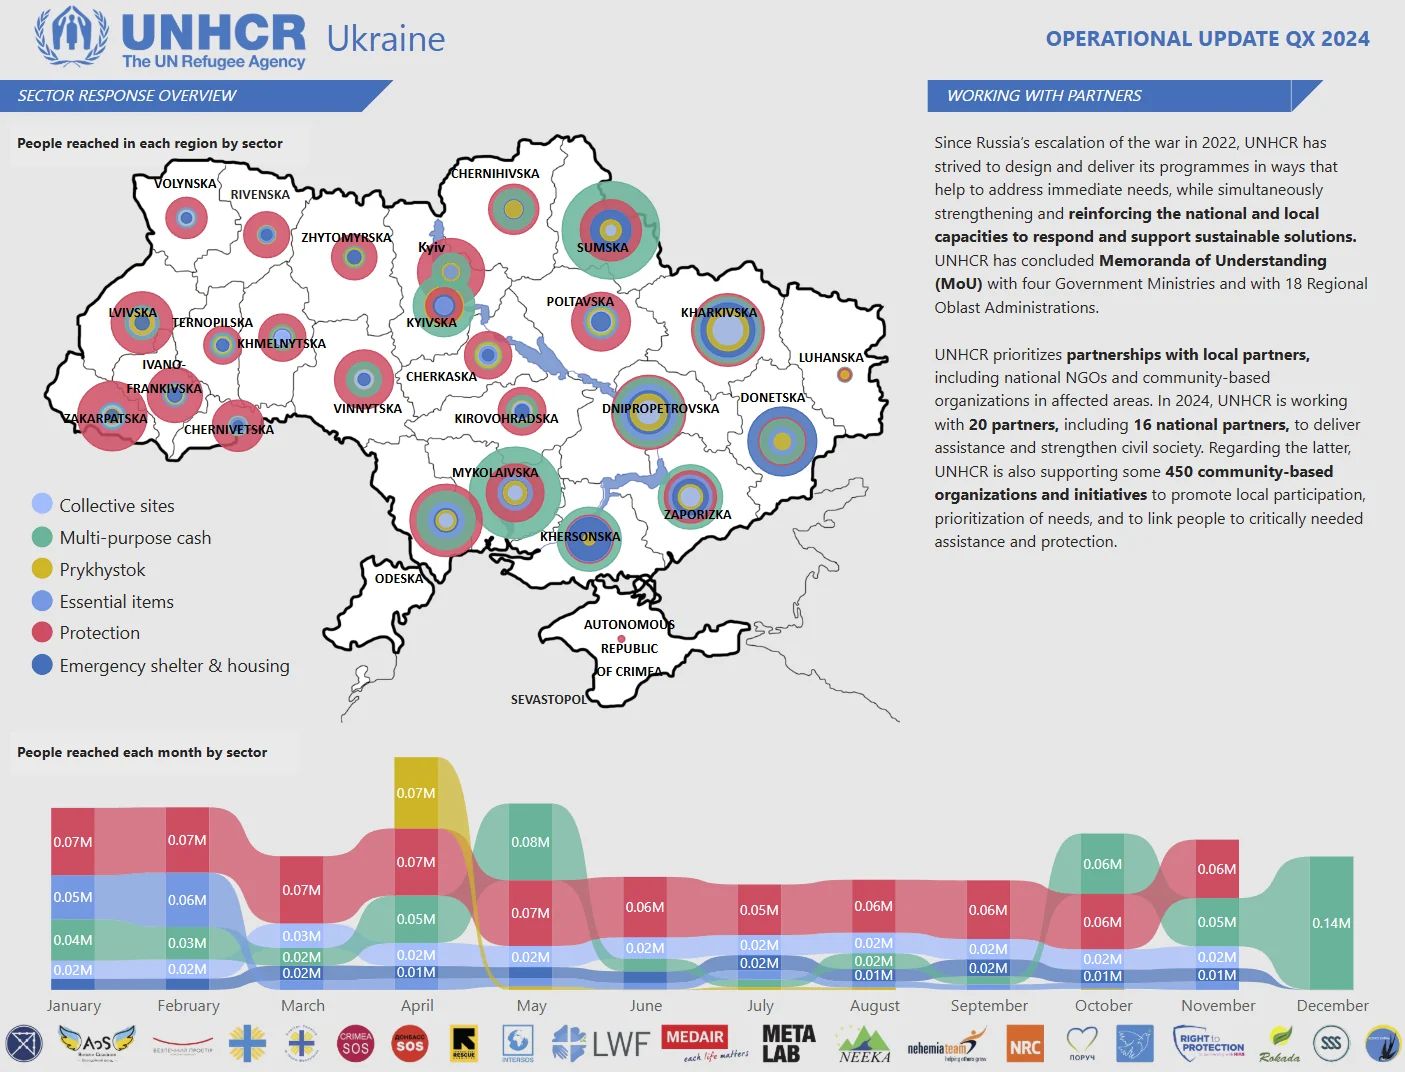
UNHCR’s Response Dashboard for Ukraine uses two main pages to show results in protection, shelter repairs and aid distributions.
03
One tool, many stakeholders
A well-made dashboard makes the same data accessible and actionable for donors, governments and field staff.
Whether it's donors, governments, or field staff, these dashboards speak a universal language: clarity and transparency.
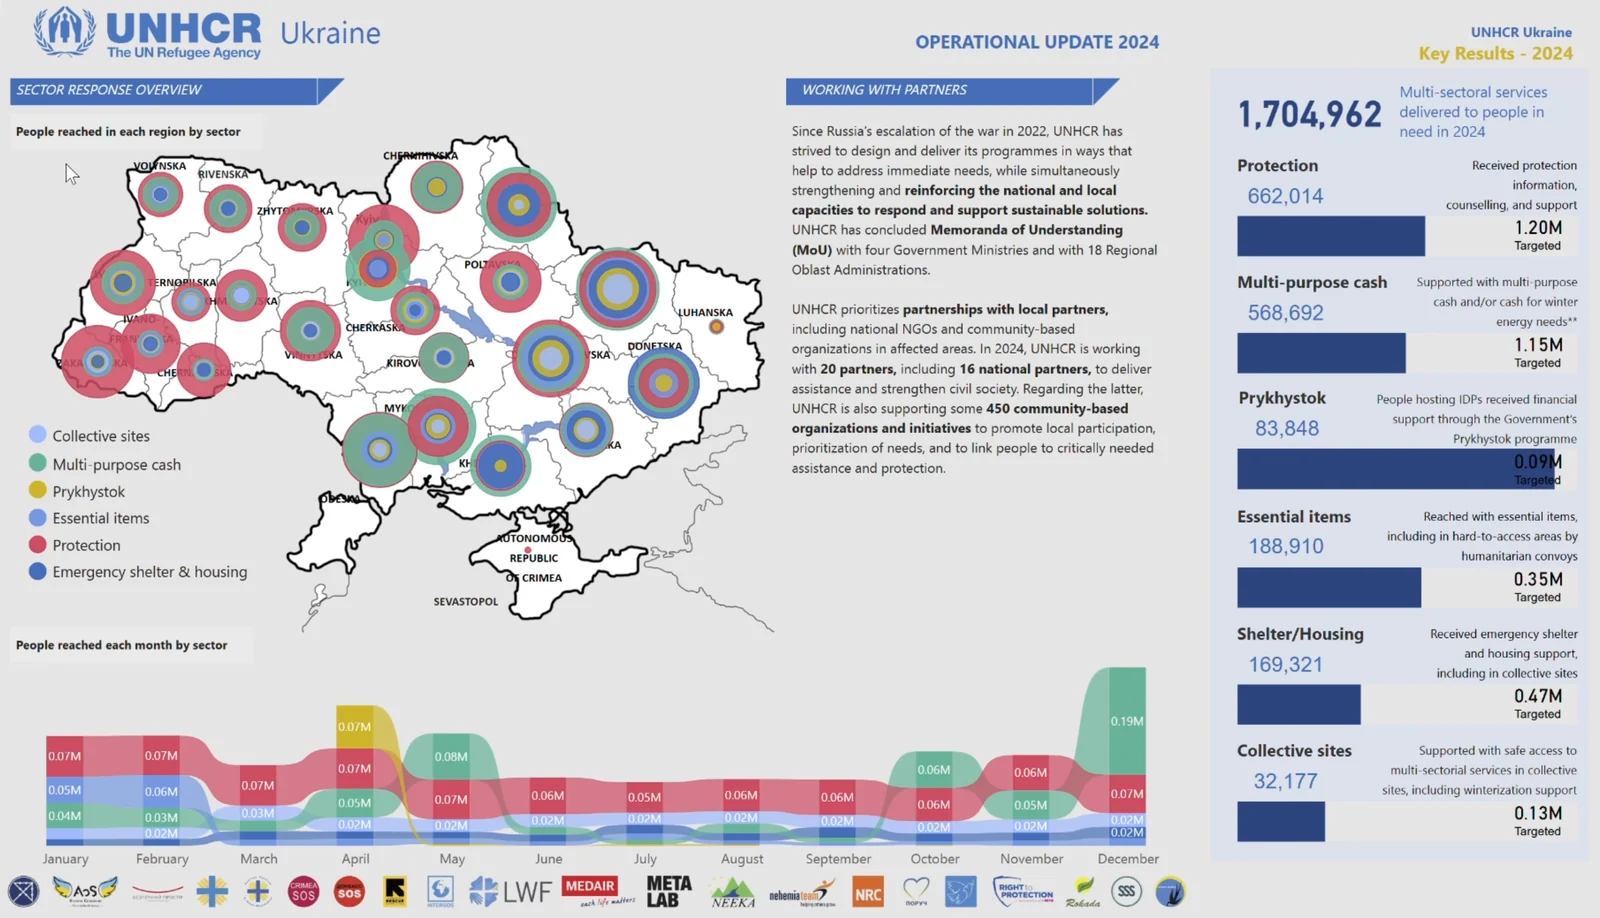
When you think of Power BI, you might imagine financial dashboards or corporate KPIs. But the same tools are being used to save lives and rebuild communities.
I’m excited to share a short video showcasing the UNHCR Response Dashboard for Ukraine, which highlights some of the incredible achievements of the organization with the help of its partners. The dashboard’s two main pages bring critical insights to life - providing a clear picture of what has been accomplished, from protection to shelter repairs, to aid distributions, for various stakeholders.
Humanitarian organizations like UNHCR are pushing the boundaries of visualization tools like Power BI, making data accessible, actionable, and impactful. Whether it's donors, governments, or field staff, these dashboards speak a universal language: clarity and transparency.
Take a look at the video and let me know your thoughts. How else do you see Power BI transforming industries beyond the corporate sphere?

Excited to hear your thoughts! If you’d like to jump into the discussion or share your insights, just follow this link, and let’s keep the conversation going:
https://www.linkedin.com/feed/update/urn:li:activity:7283428865971019776?utm_source=share&utm_medium=member_desktop