No. 04 · · 2 min read
Beyond the Data: The Human Cost
How do you design a chart when every number in it is a person, and no chart can fully convey that pain?
The idea
Behind every figure is a life. Designing for an emotionally charged topic means choosing color with care, and making a chart that informs, invites reflection and helps us remember.
01
Every number is a person
The deeper the author went into the data, the heavier the stories behind the figures became.
02
Black for strikes, red for fatalities
Black and its shades mark shelling and air strikes, and red is kept for the fatalities.
03
Inform, reflect, remember
The two-page infographic, built on ACLED data, sets out to inform, to reflect and to remember.
Each figure isn’t just a statistic - it’s a life lost, a family shattered, an irreplaceable void.
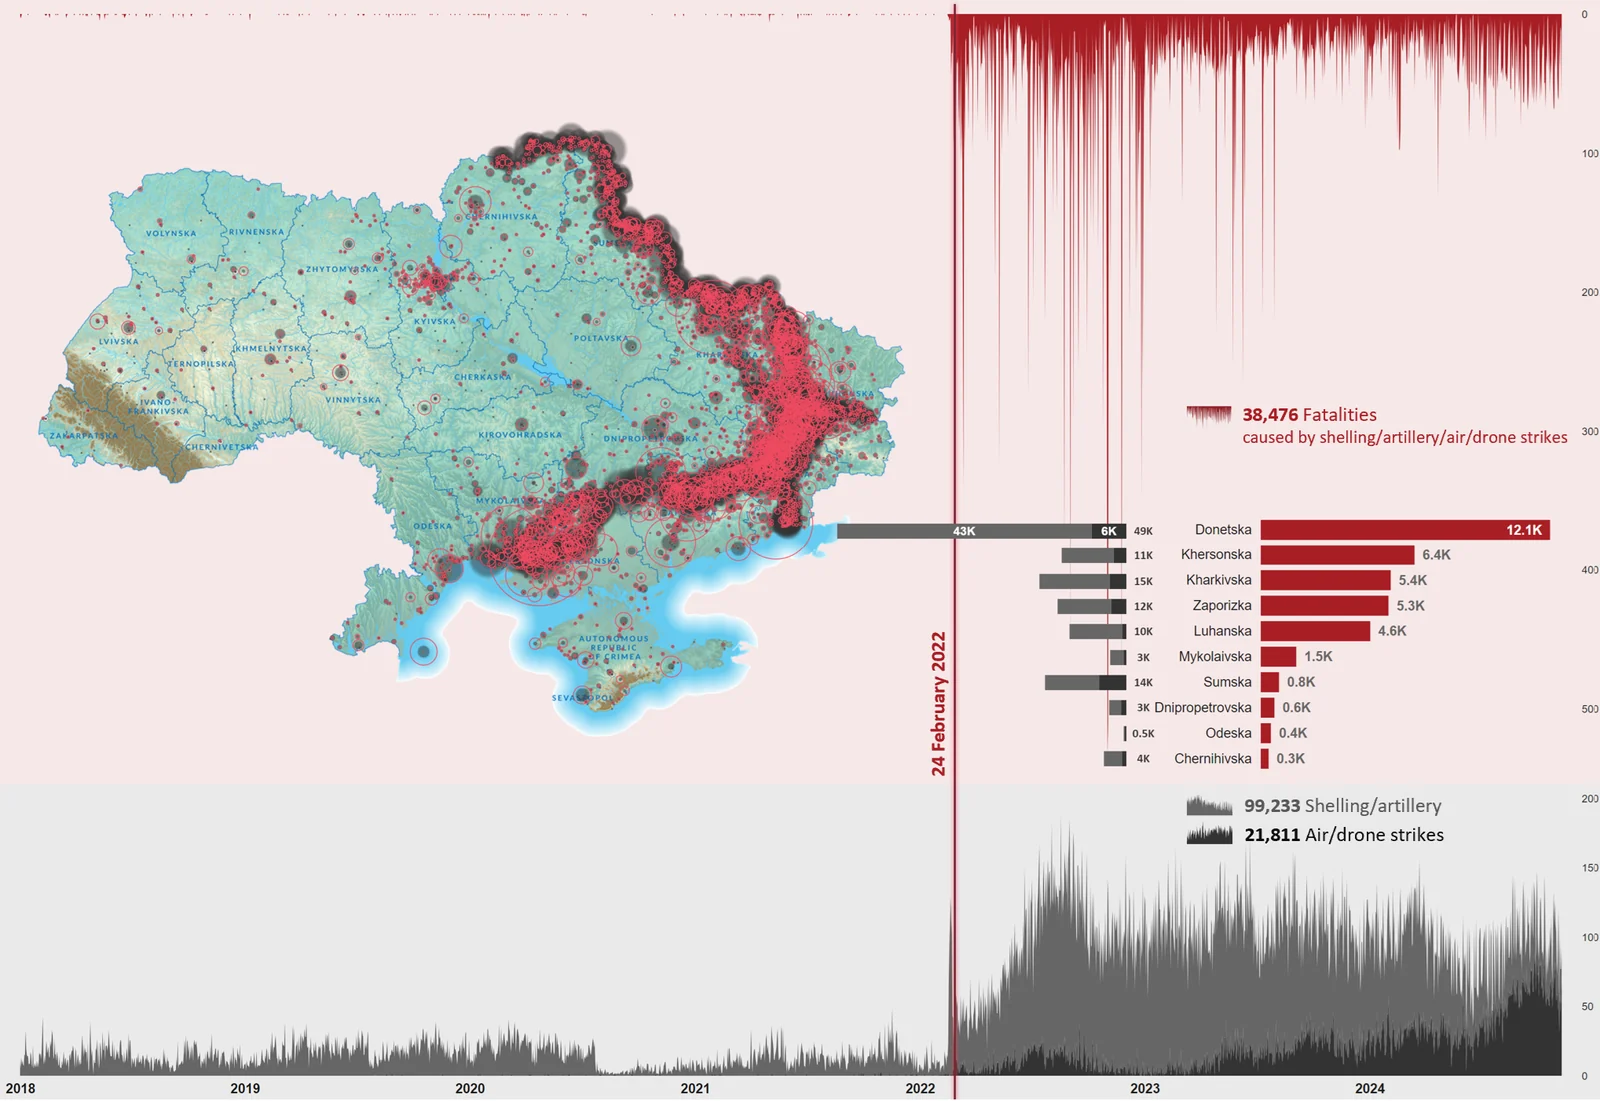
Working on this infographic was one of the most challenging tasks I’ve undertaken - not because of the data itself, but because of what it represents. The more I delved into the numbers, the more I felt the weight of the stories behind them.
Each figure isn’t just a statistic - it’s a life lost, a family shattered, an irreplaceable void. Each bloodshed leaves behind pain that no chart or graph can truly convey.
This two-page infographic, based on ACLED data, illustrates the devastating impact of shelling, artillery, air/drone strikes, and the tragic fatalities they cause. It’s a stark reminder of the human cost and why we must never grow numb to the numbers.
As difficult as it was to create, I hope this visualization serves its purpose: to inform, to reflect, and to remember.
In visualizing such a heavy topic, I used black and shades of it for shelling and air strikes, and red to represent fatalities - choices meant to convey the gravity of the data. How do you approach color and design when creating visuals for emotionally charged subjects? Do you think certain visual styles resonate better with audiences in these contexts?
Excited to hear your thoughts! If you’d like to jump into the discussion or share your insights, just follow this link, and let’s keep the conversation going:
https://www.linkedin.com/feed/update/urn:li:activity:7266133314376237057/