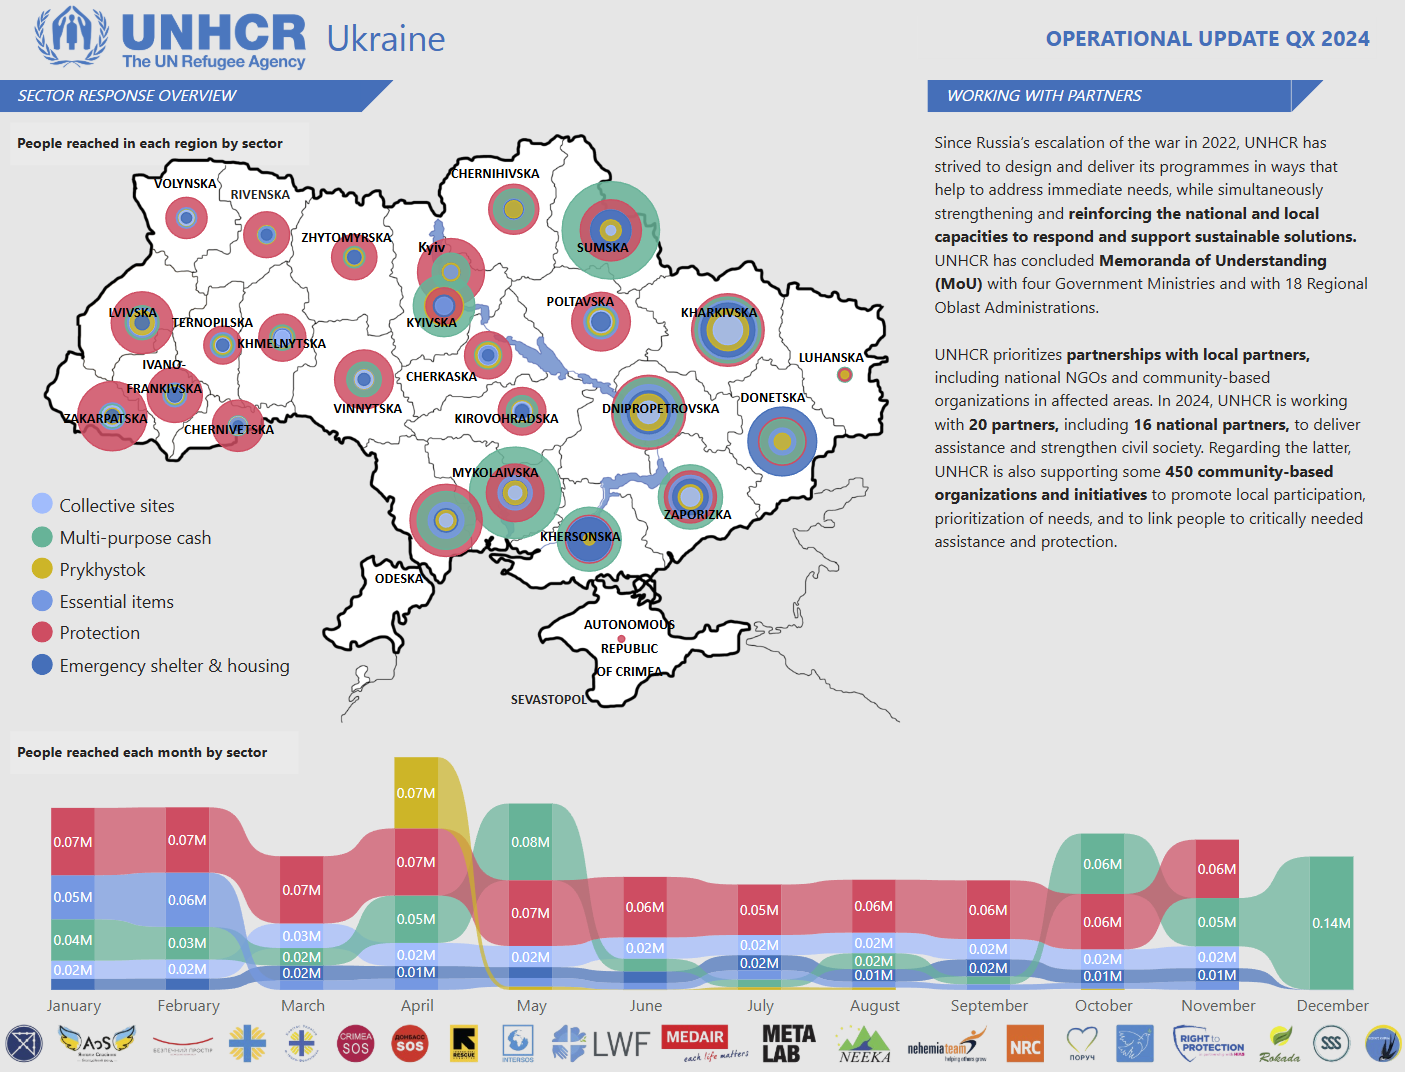
4 min read 0 Data Challenges DataViz Creating Dashboards with Purpose: Serving Diverse Stakeholders with a Single Tool Alen Chalak December 15, 2024
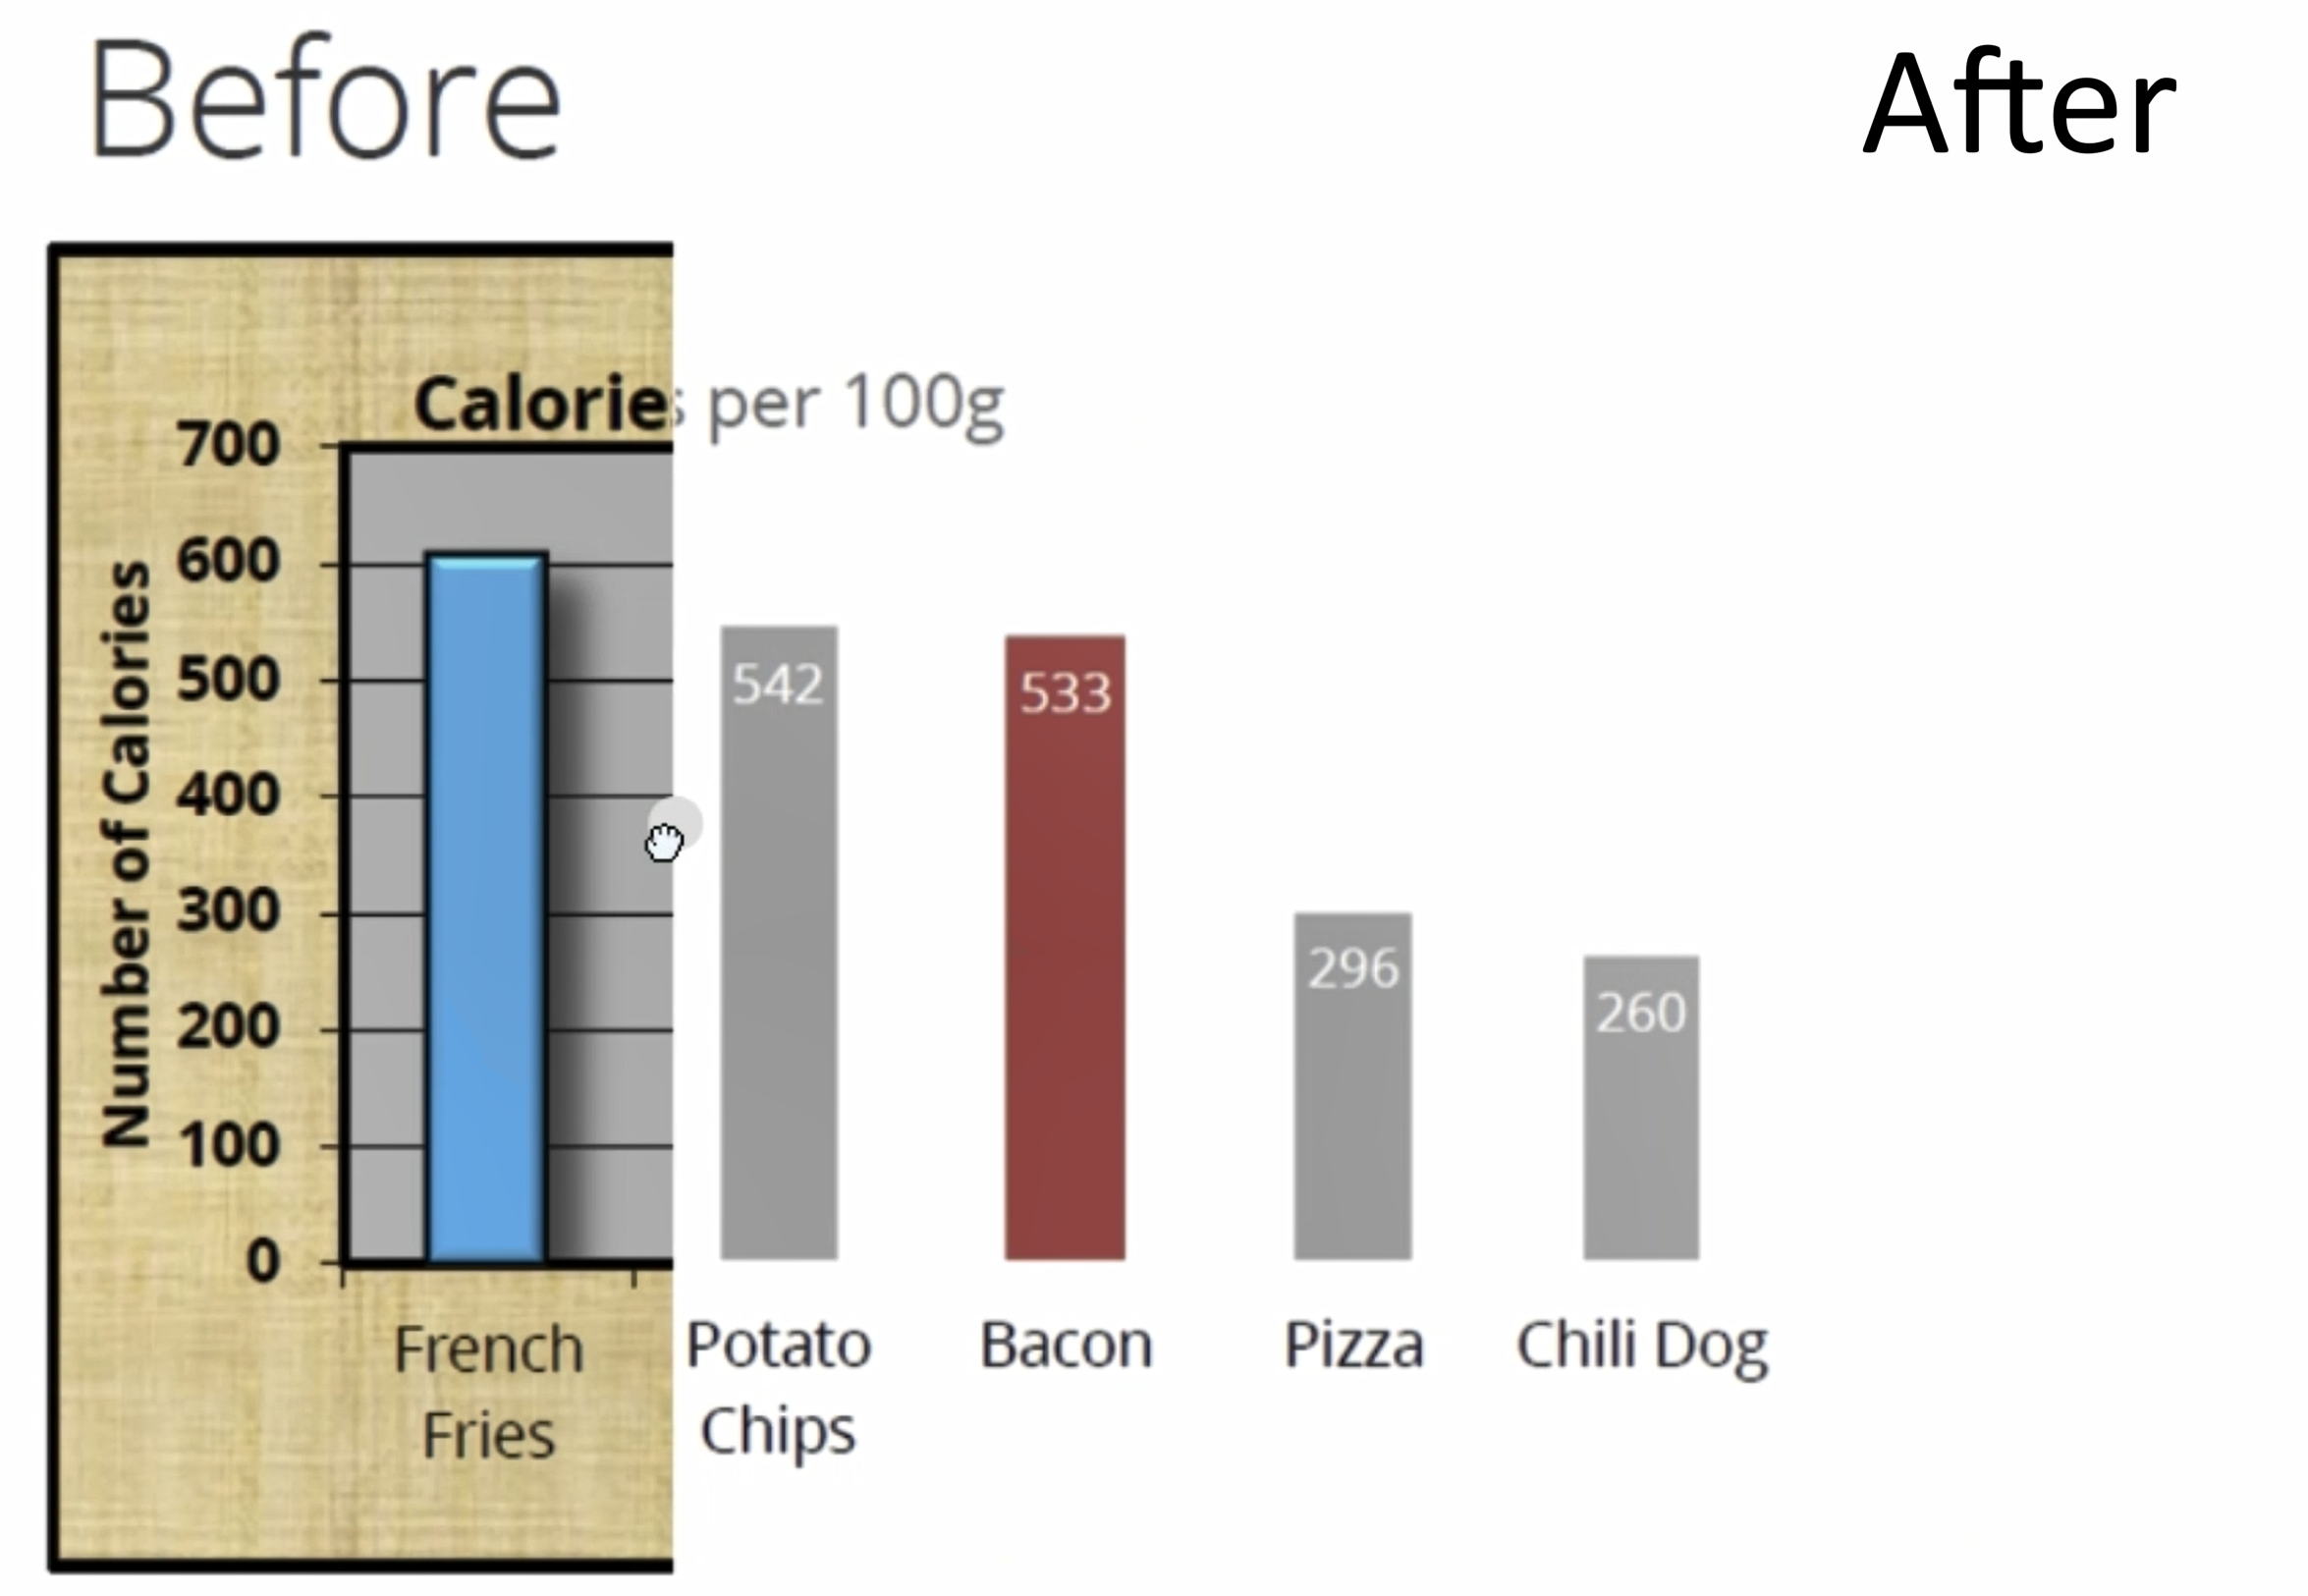
2 min read 0 DataViz Color Tints: Fixing the Chaos in Data Visualization 🎨 Alen Chalak December 7, 2024
2 min read 0 Data Challenges DataViz 🎶 Dancing Data: A Case for Open and Responsible Sharing Alen Chalak December 4, 2024
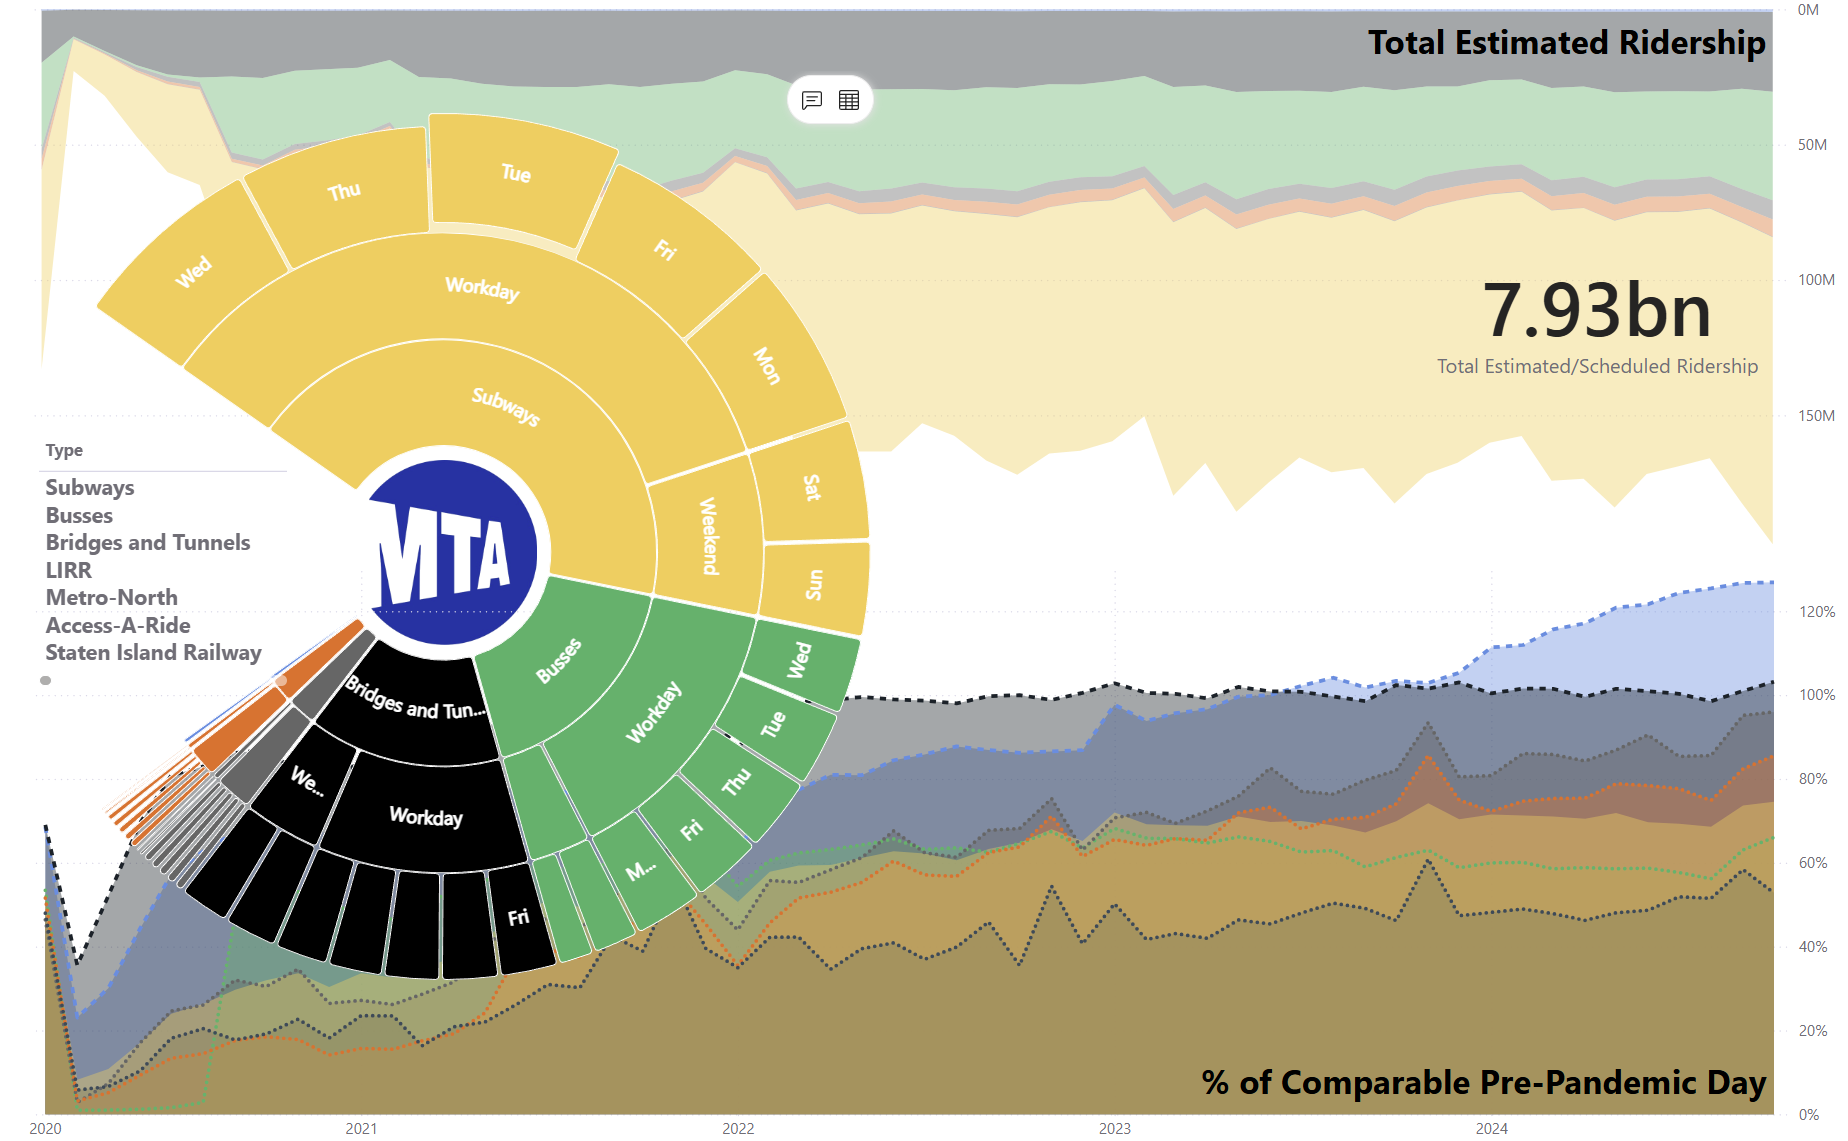
1 min read 0 Data Challenges DataViz Ever felt like your charts have too much going on? Alen Chalak November 24, 2024
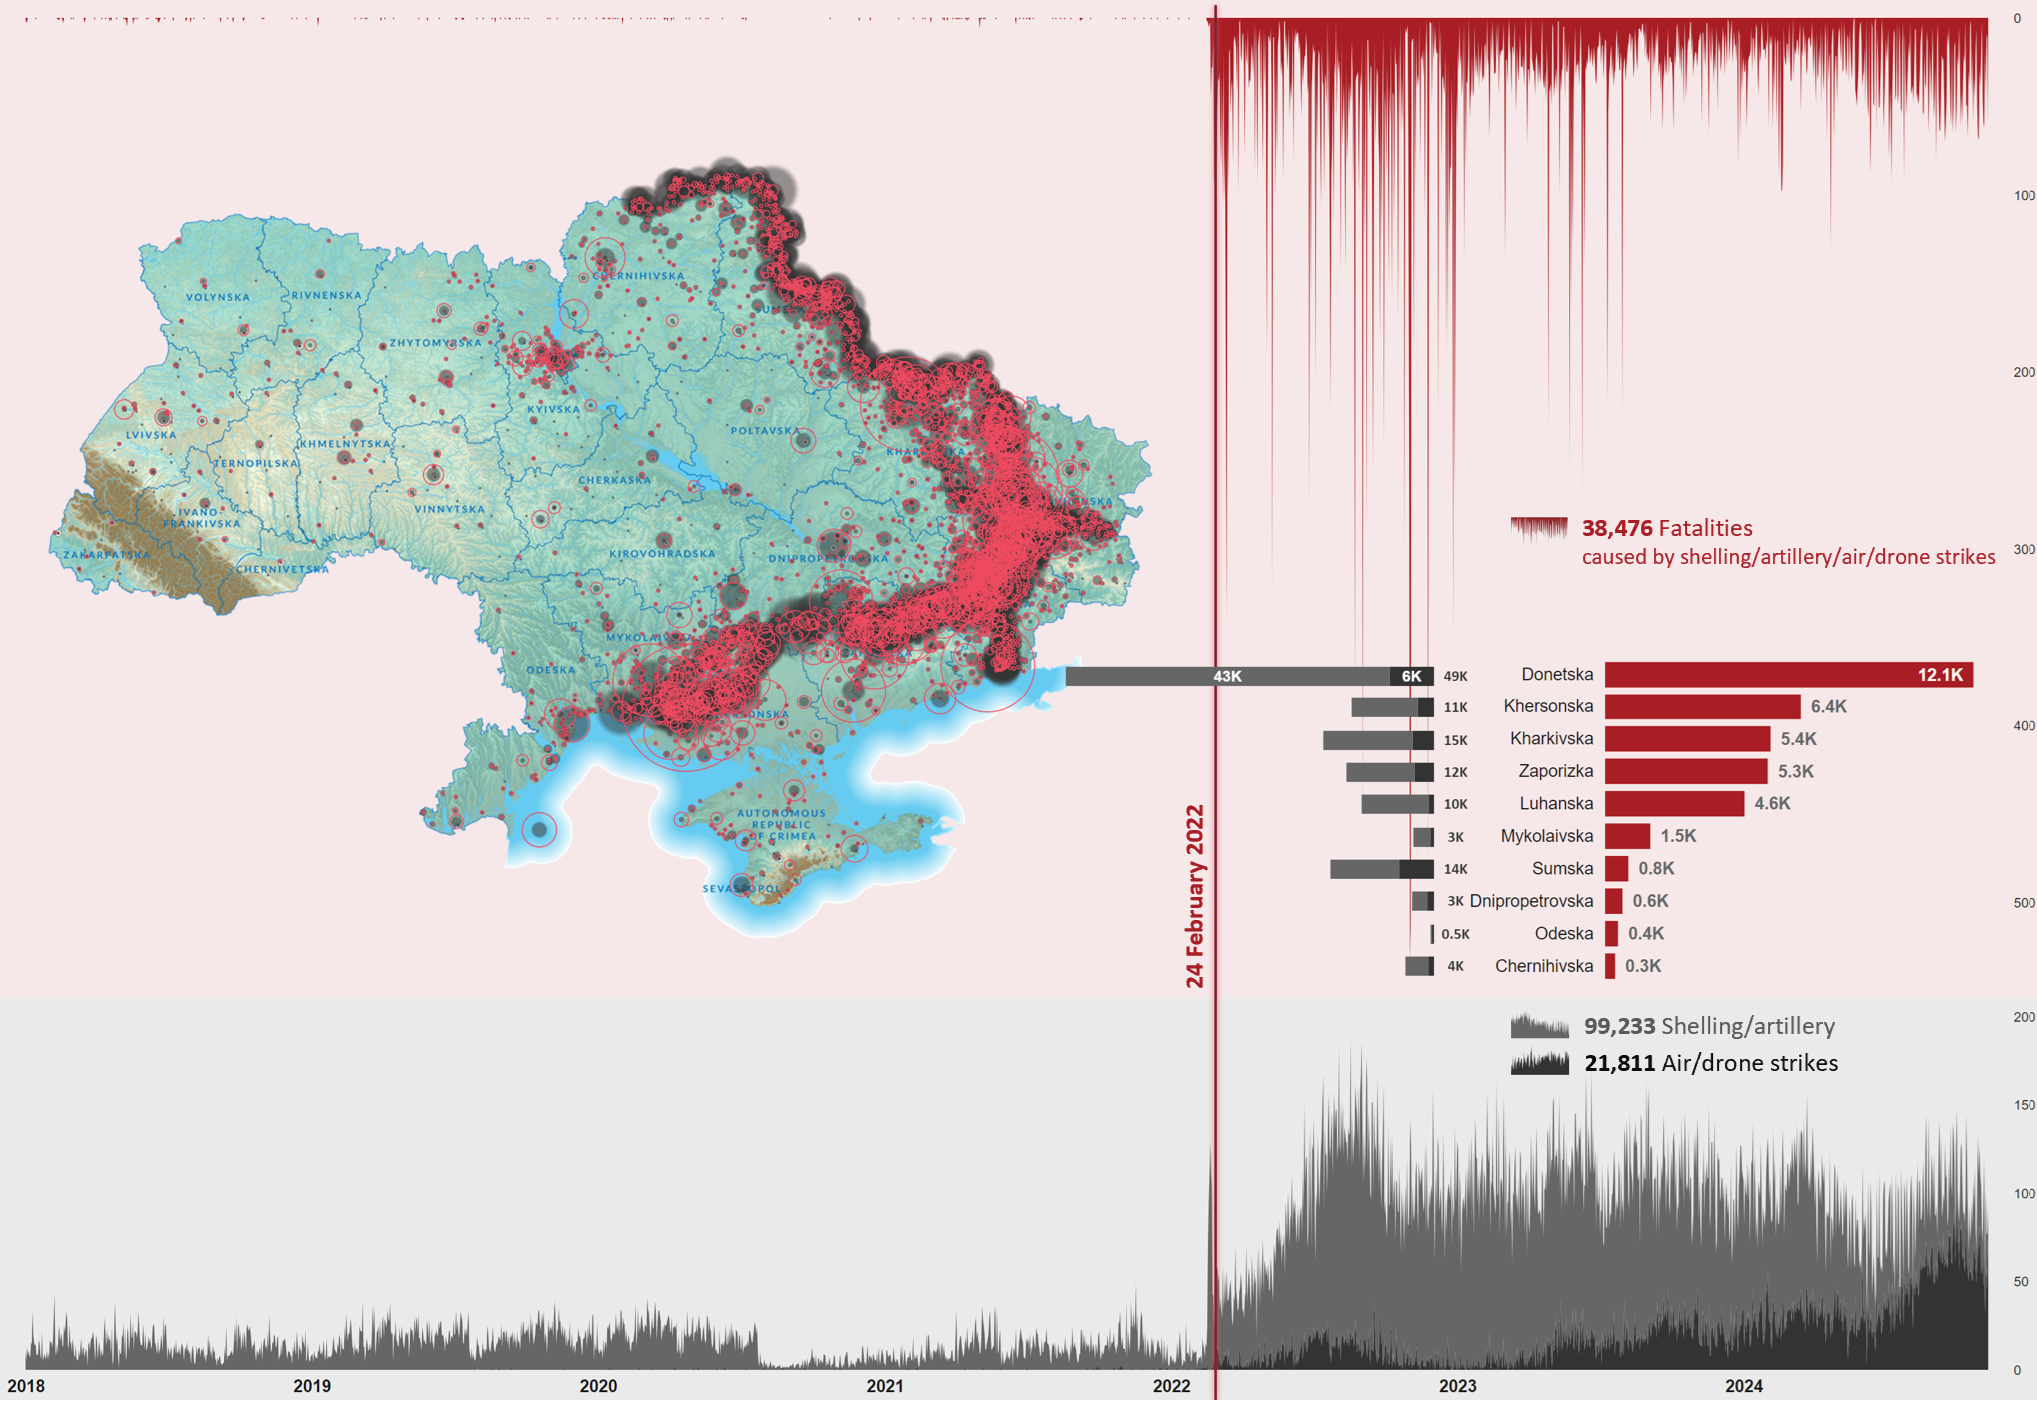
4 min read 0 Data Challenges DataViz Paradox of Data Fragmentation in Humanitarian Responses Alen Chalak October 20, 2024
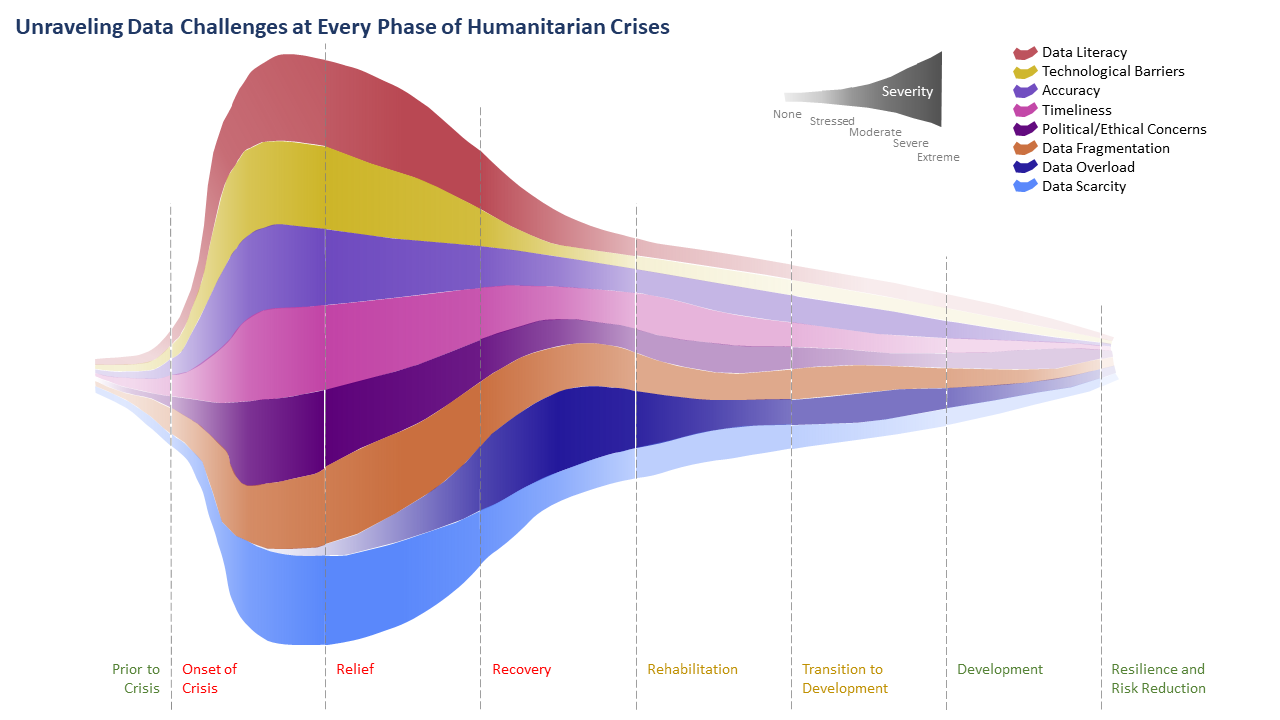
2 min read 14 Data Challenges DataViz Unraveling Data Challenges at Every Phase of Humanitarian Crises Alen Chalak October 17, 2024