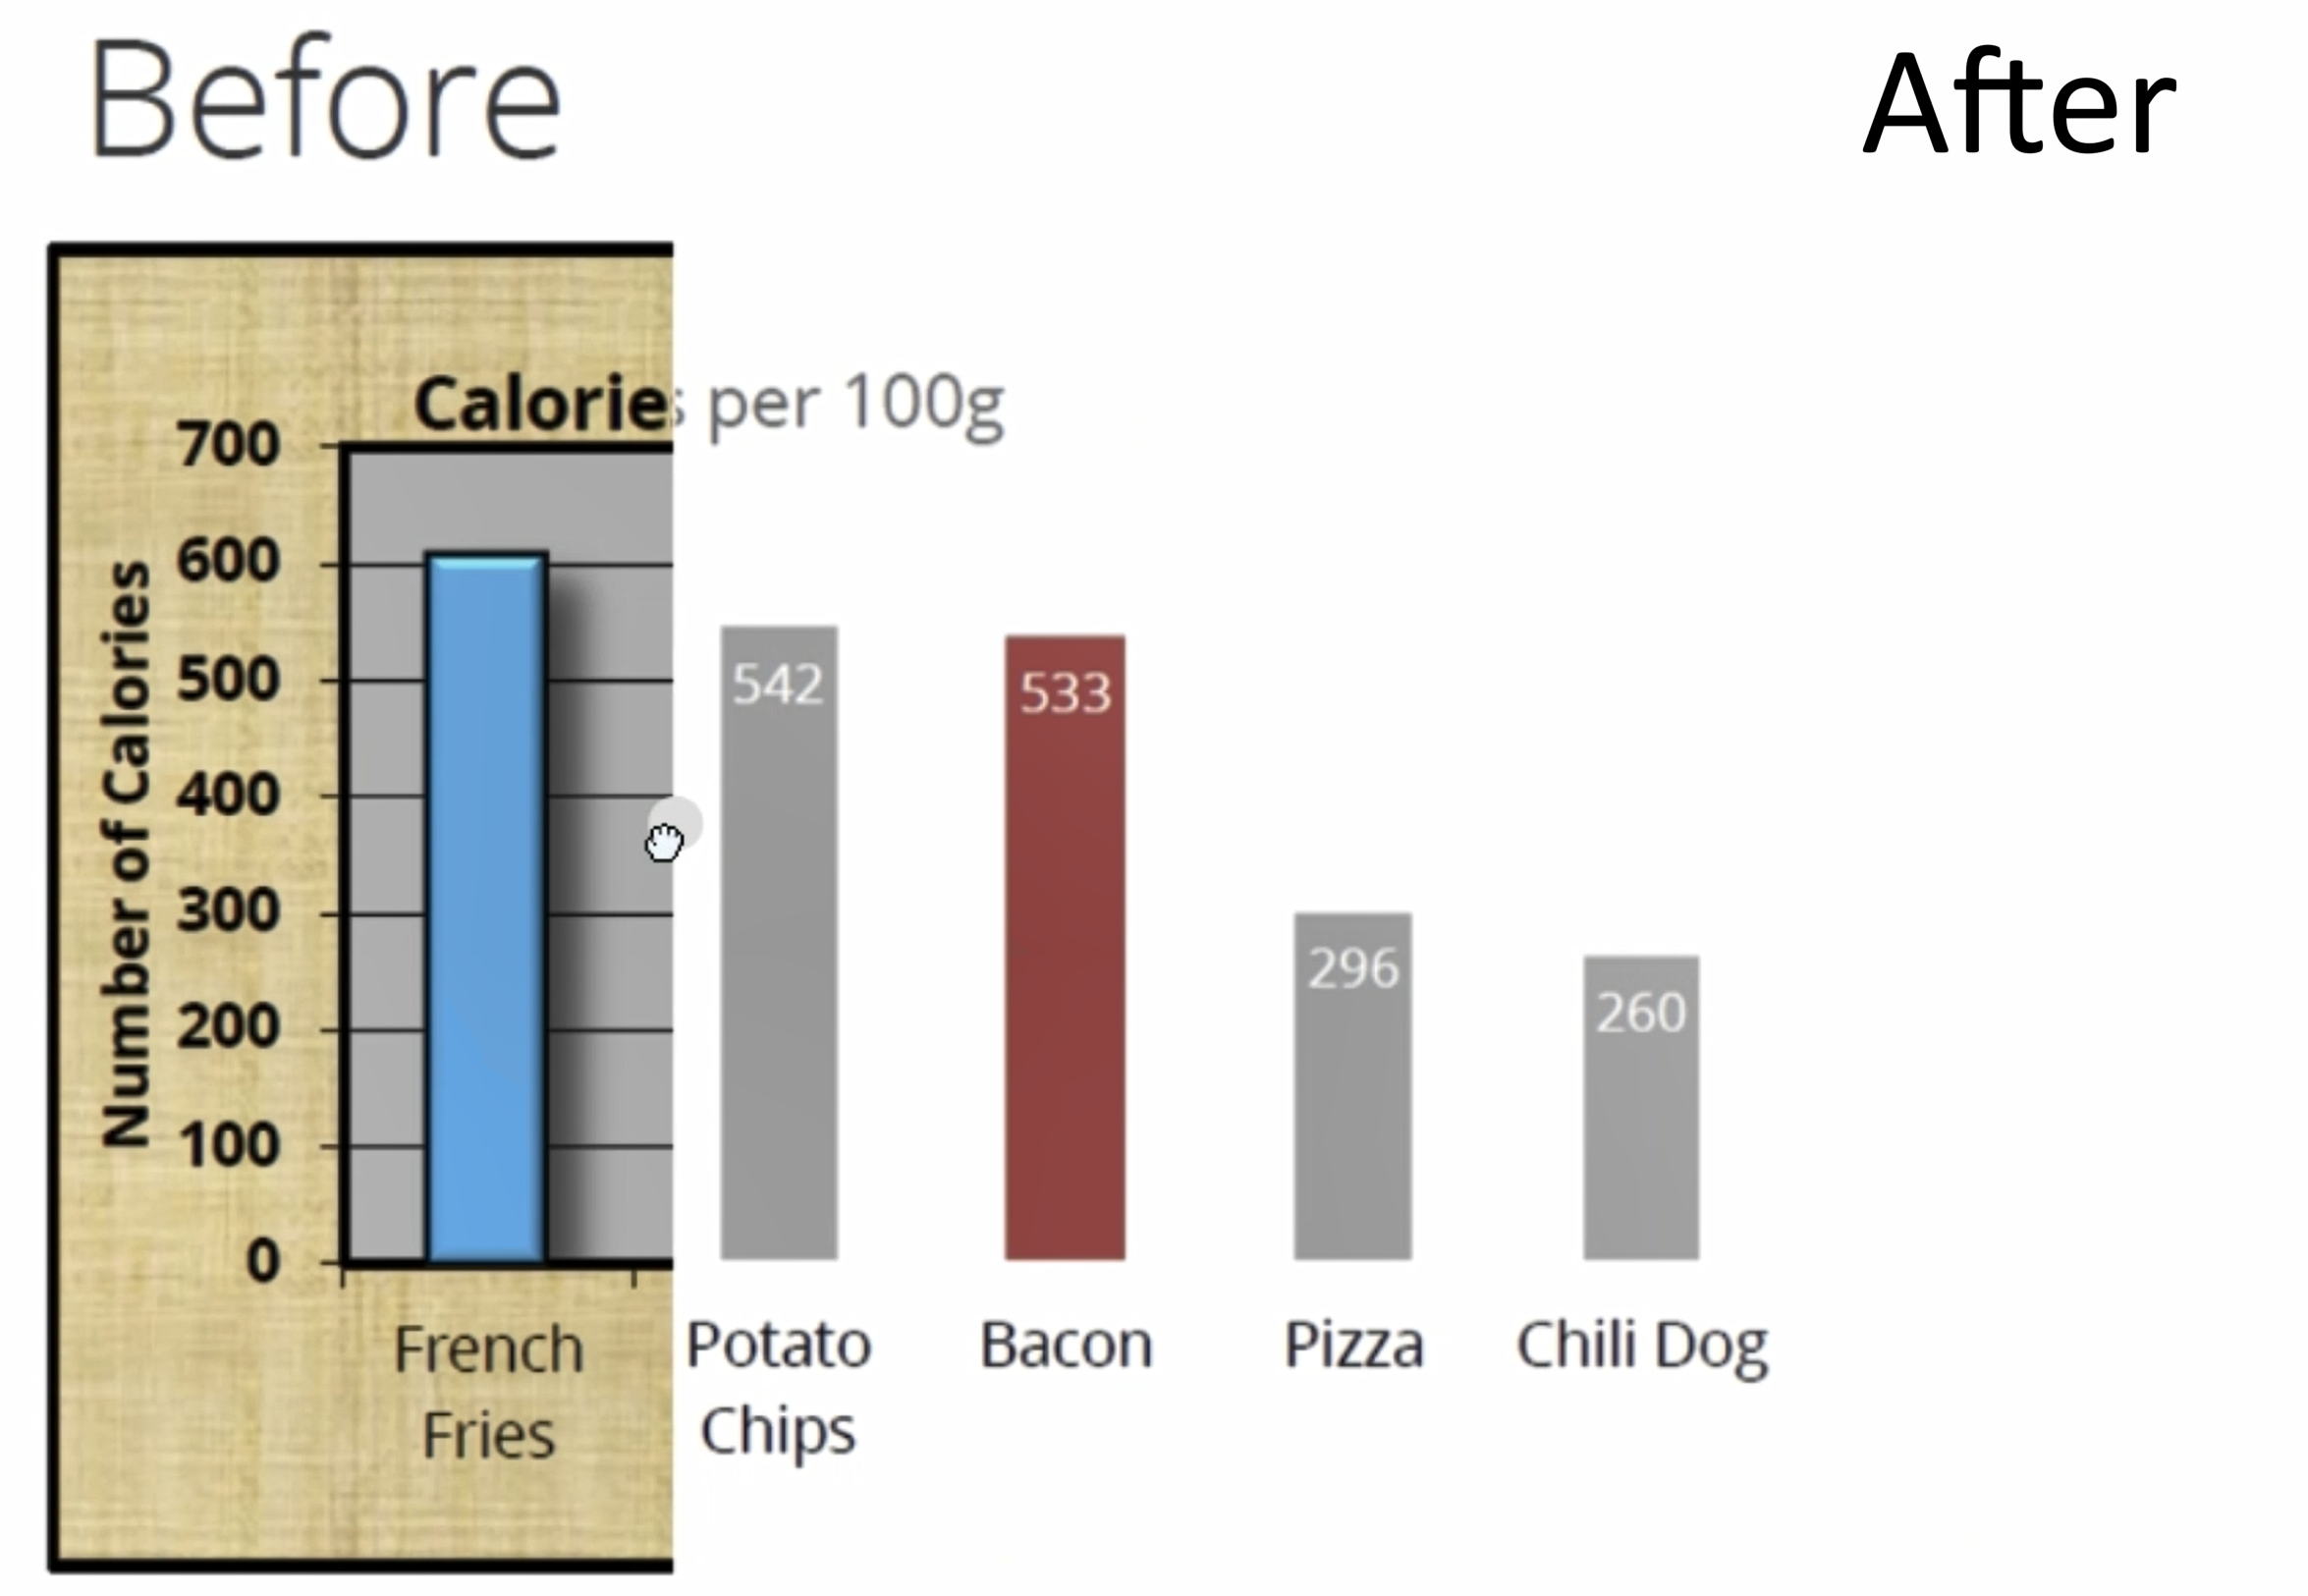
Skip to content
Humanitarian Data Visualization

Humanitarian Data Visualization

#HumDataViz

Month: November 2024

  • Home
  • 2024
  • November
Ever felt like your charts have too much going on?
1 min read 0
  • Data Challenges
  • DataViz

Ever felt like your charts have too much going on?

  • Alen Chalak
  • November 24, 2024
Beyond the Data: The Human Cost
2 min read 0
  • DataViz

Beyond the Data: The Human Cost

  • Alen Chalak
  • November 23, 2024

Recent Posts

  • Why the Easiest, and Prettiest Map Isn’t Always the Best Map
  • Are We the Minions of the Information World?
  • When a Donut Chart Shifted the Narrative
  • From I to Cube: The Leadership Shape Evolution
  • The Global Humanitarian Appeal budget and …

Archives

  • May 2025
  • April 2025
  • February 2025
  • January 2025
  • December 2024
  • November 2024
  • October 2024

Categories

  • Data Challenges
  • DataViz
  • Uncategorized

Recent Posts

  • Why the Easiest, and Prettiest Map Isn’t Always the Best Map
  • Are We the Minions of the Information World?
  • When a Donut Chart Shifted the Narrative
  • From I to Cube: The Leadership Shape Evolution
  • The Global Humanitarian Appeal budget and …

Recent Comments

    Archives

    • May 2025
    • April 2025
    • February 2025
    • January 2025
    • December 2024
    • November 2024
    • October 2024

    Categories

    • Data Challenges
    • DataViz
    • Uncategorized

    Meta

    • Log in
    • Entries feed
    • Comments feed
    • WordPress.org

    Recent Comments

    No comments to show.
    Copyright © 2025 Humanitarian Data Visualization Theme: Complete Blog By Adore Themes.