4 min read 0 Data Challenges DataViz Paradox of Data Fragmentation in Humanitarian Responses Alen Chalak October 20, 2024
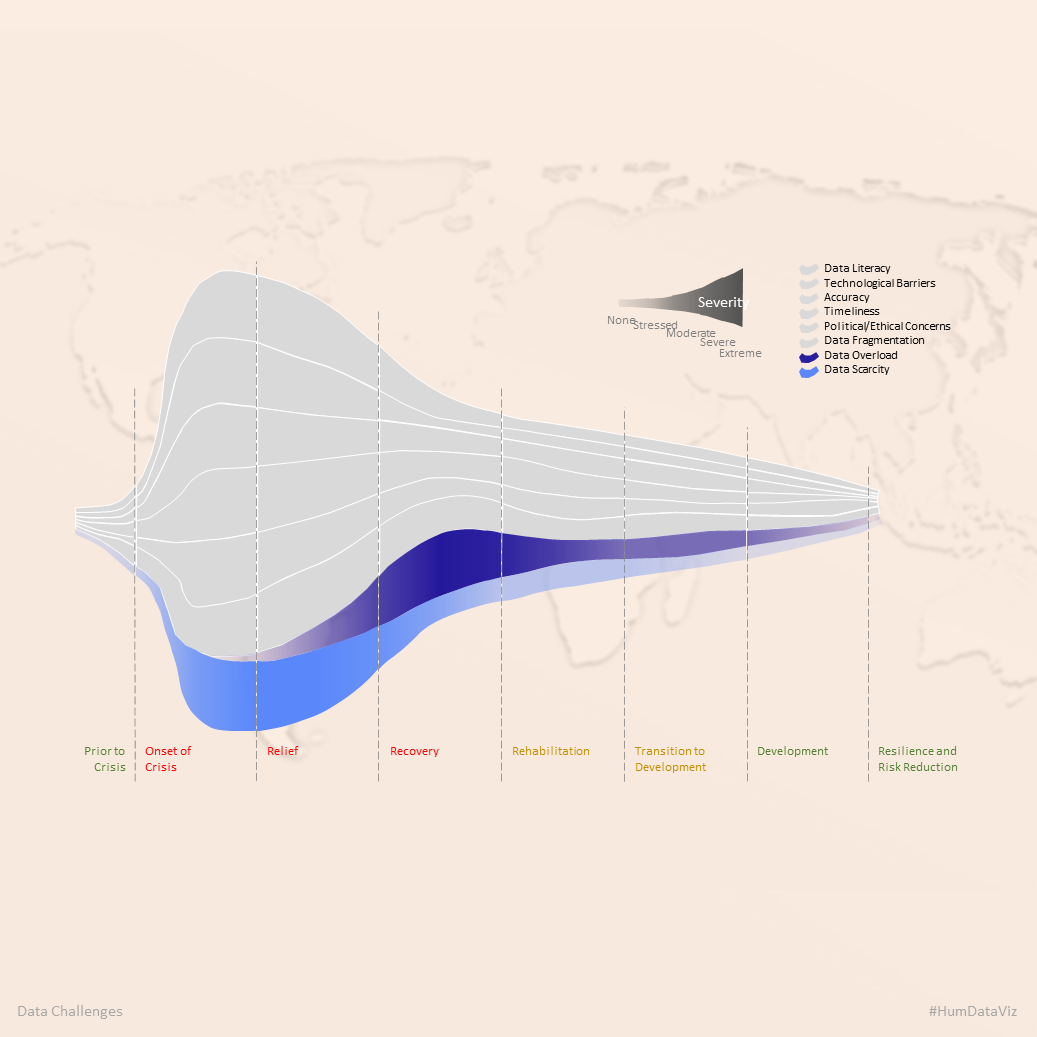
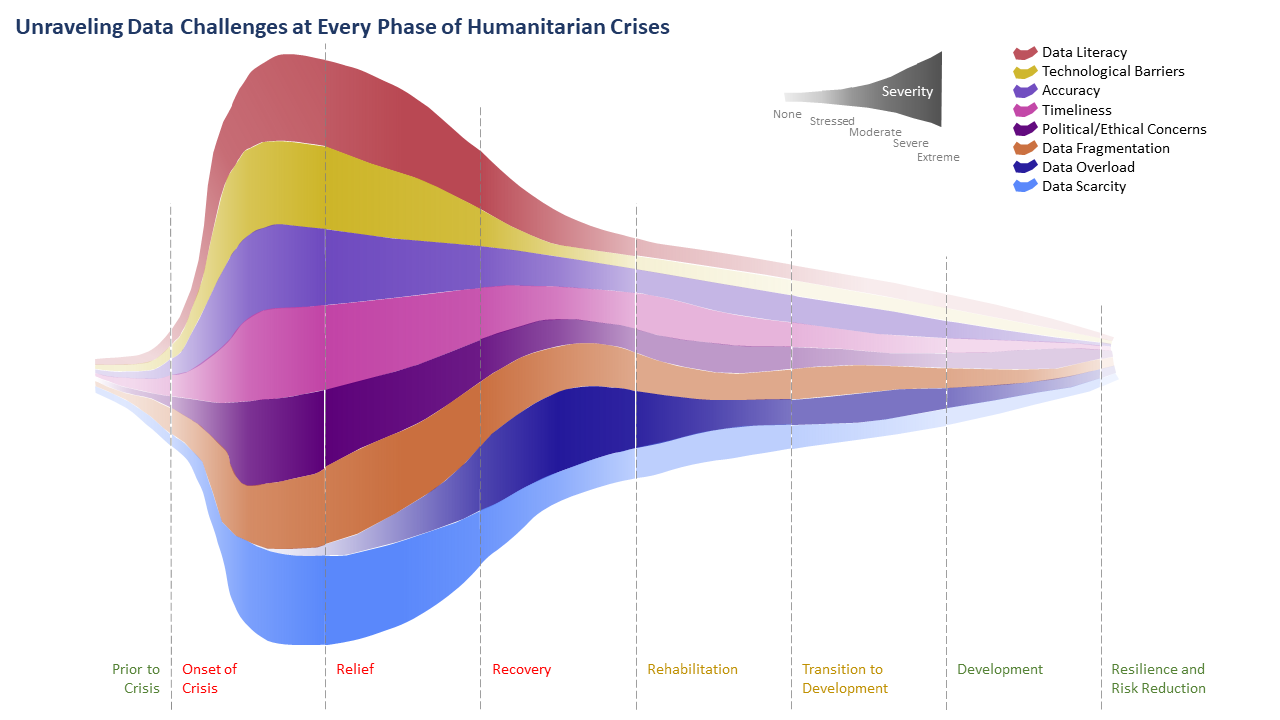
2 min read 14 Data Challenges DataViz Unraveling Data Challenges at Every Phase of Humanitarian Crises Alen Chalak October 17, 2024