No. 14 · · 3 min read
Why Your Graph is Lying to You (And How to Fix It)
Reports often present survey statistics as absolute truths. But what if two bars that look equally certain deserve very different levels of trust?
The idea
Every survey estimate carries uncertainty, and indicators from the same survey can carry very different amounts. Put the margin of error in the chart itself, so readers know how much to trust each number.
01
Precision can be an illusion
Sample size, confidence level and margin of error usually sit in the methodology section, far from the charts people actually read.
02
Hidden uncertainty erodes trust
Hidden margins breed overconfidence, and when a later report differs, people blame the data, even though sampling variation is normal.
03
Show it, then flag it
Use error bars or confidence bands, and mark small-sample or wide-margin indicators with a caution symbol or footnote.
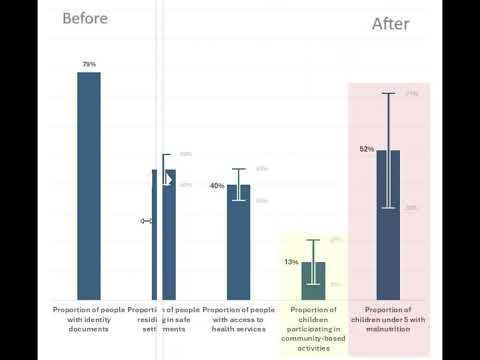
Decision-makers should not trust these two statistics equally!
The Illusion of Precision
In reports, numbers are often presented as absolute truths. Below is the extract from one single report:
79% of people have identity documents
40% of households have access to health services
52% of children under 5 suffer from malnutrition
These statistics seem precise. They look reliable.
But there’s a problem - where is the uncertainty?
In humanitarian response, economic forecasting, or even public health, data comes with uncertainty. But when we strip away error margins in our analysis and visualizations, we unintentionally give stakeholders a false sense of precision.
Most surveys include information on sample size, confidence level, and margin of error - but they bury it in the methodology section, far from the visualized data. Decision-makers see shiny graphs with exact percentages and assume them to be facts, leading to overconfidence and misinformed decisions.
Why Ignoring Error Margins is Dangerous
- Overconfidence in Data
A percentage like 52% of child malnutrition might actually range between 32% and 71% due to a small sample size. Without visualizing this, we trick decision-makers into believing an uncertain number is a certainty.
- Loss of Trust in Data
When new reports show different numbers, stakeholders often assume the data was incorrect. But in reality, fluctuations occur naturally due to sampling differences - they just weren’t aware of the uncertainty before.
The Reality of Humanitarian Data: Different Samples, Different Uncertainties
Most reports state a single confidence level and margin of error for the entire survey - but each indicator has its own level of uncertainty.
For example, in the same survey, actual responses might vary significantly, due to the nature of the questions and their target audience:

➡️ Decision-makers should not trust these two statistics equally!
The first is a stable estimate, while the second is highly uncertain.
➡️ Yet, both would appear the same in a traditional chart.
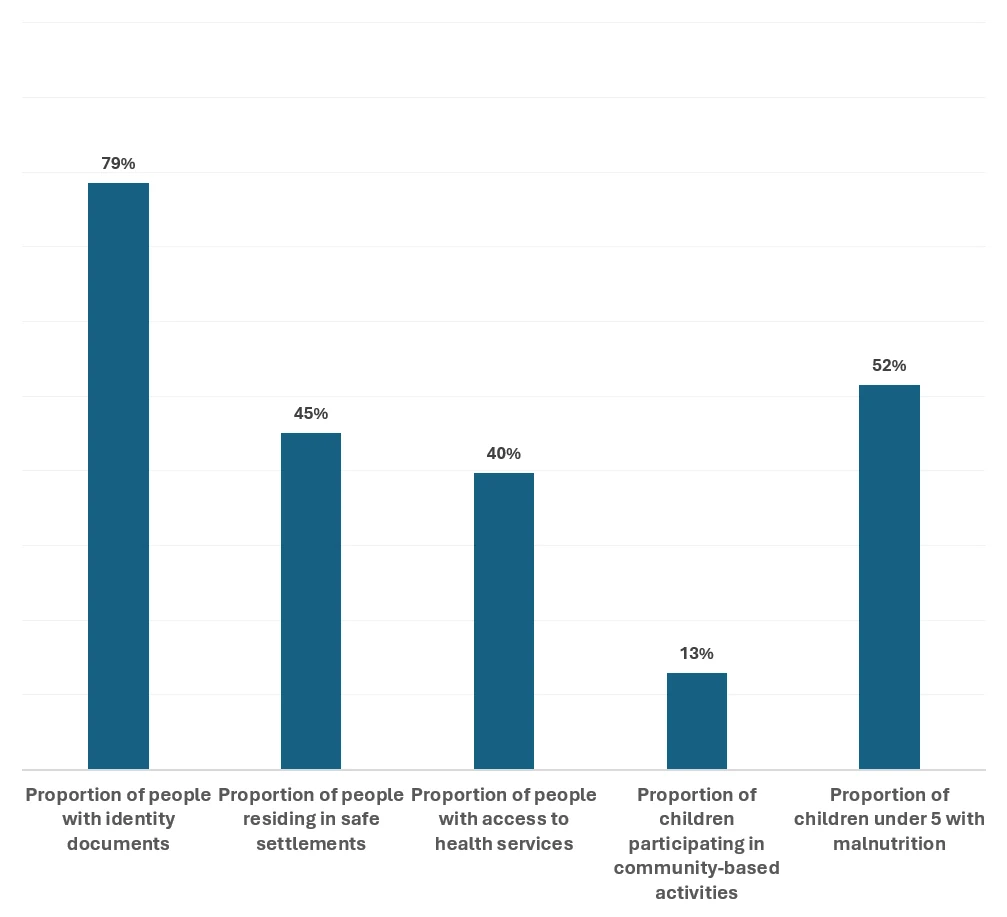
Looks precise, right? But this graph hides the uncertainty behind the numbers, creating a false sense of accuracy. Decision-makers relying on this may assume these figures are absolute facts - when in reality, they might be significantly different.
The Right Approach: Visualizing Uncertainty
Instead of hiding uncertainty, we should show it using the following methods:
- Use Error Bars and/or Confidence Bands in Charts
- Flag Indicators with High Uncertainty
If an indicator has a small sample size and large error margin, highlight it with a caution symbol or footnote.
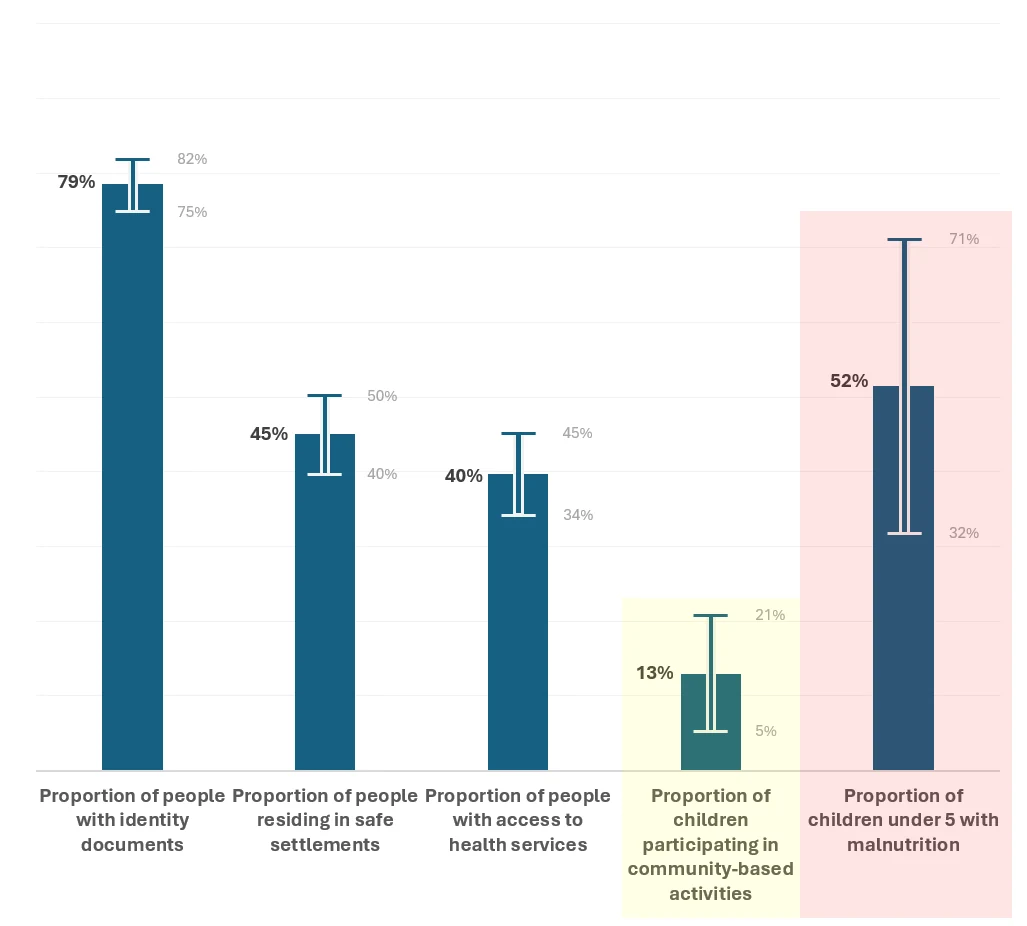
Now we see the full picture. By including error margins, we acknowledge the uncertainty in the data and provide a more honest representation. This helps stakeholders make informed decisions instead of assuming misleading precision.
Conclusion: Embracing Uncertainty = Better Decision-Making
Data is powerful - but only if we communicate it correctly.
Data Managers must stop presenting numbers as absolute truths.
Visualizing error margins leads to smarter decisions and better outcomes.
At the end of the day, no dataset is perfect, and that’s okay. What matters is how we communicate its limitations.
Would love to hear your thoughts - have you ever seen data misused due to a lack of context?